
Implementation of Machine Learning Workflows with NVIDIA cuML, RAPIDS, GPU Benchmarking, Explainability, Clustering, and Model Inference
MarkTechPost Sana Hassan

NVIDIA cuML is used to run common ML jobs on the GPU with tiny code changes. The big hook: it also shows where GPU speed stops, and CPU fallback starts.
Based on reporting by MarkTechPost, Sana Hassan — read the original for the full story.
Summary, retelling and take written by AI under human oversight; images are AI-generated illustrations. How we work · Report an error
This tutorial is really two stories at once. One is the obvious one: cuML can make familiar machine-learning work run on NVIDIA GPUs. The other is the more useful one: it shows where that speed comes from, where it leaks away, and how much plumbing is needed to keep data on the device.
It starts by checking for an NVIDIA GPU, setting up RAPIDS if needed, and wiring in a simple timing helper that synchronizes CUDA work before measuring. That matters because GPU code can look absurdly fast if you time it badly. The tutorial also uses cuML’s accel path to run an unmodified scikit-learn script, then compares that against the same workload run through cuML’s profiler. One of the examples, Ridge with positive=True, falls back to CPU, which is exactly the kind of detail this kind of demo usually skips.
From there, the piece moves into native cuML. It uses GPU-generated blobs, then checks how CuPy arrays, cuDF DataFrames, and cuML transformations fit together. There’s even a pointer check to show whether data stayed on the same device memory, plus an example of output-type control so results can stay in CuPy form or be converted to NumPy when needed. The warning is plain: if every step converts back to NumPy, the whole point starts to evaporate.
The benchmarking section is the meat. It compares CPU and GPU versions of PCA, K-Means, nearest-neighbor search, logistic regression, random forests, and DBSCAN. The data sizes are specific: 200,000 by 64 for the main benchmark, 50,000 by 32 for random forests, 50,000 index points with 5,000 queries for nearest neighbors, and 20,000 by 8 for DBSCAN. It also records speedups rather than just raw times, which makes the results easier to read than the usual parade of isolated numbers.
Then it branches into more advanced GPU work: UMAP, t-SNE, HDBSCAN, trustworthiness scores, FIL inference, SHAP explanations, hyperparameter optimization with scikit-learn meta-estimators, and model serialization with portability checks between GPU and CPU environments. The through line never changes. Keep the data on the device, measure carefully, and don’t assume every familiar scikit-learn pattern maps cleanly to the GPU.
My take — AI-written commentary, not fact-checked reporting
This is the sane way to pitch GPU ML: show the speed, then immediately show the seams. Too many demos act like the GPU is a magic box; this one at least admits there’s fallback, data movement, and a cost to every NumPy detour. That honesty is refreshing, which is a polite way of saying it’s rare.
Read more about this at: MarkTechPost
Related stories
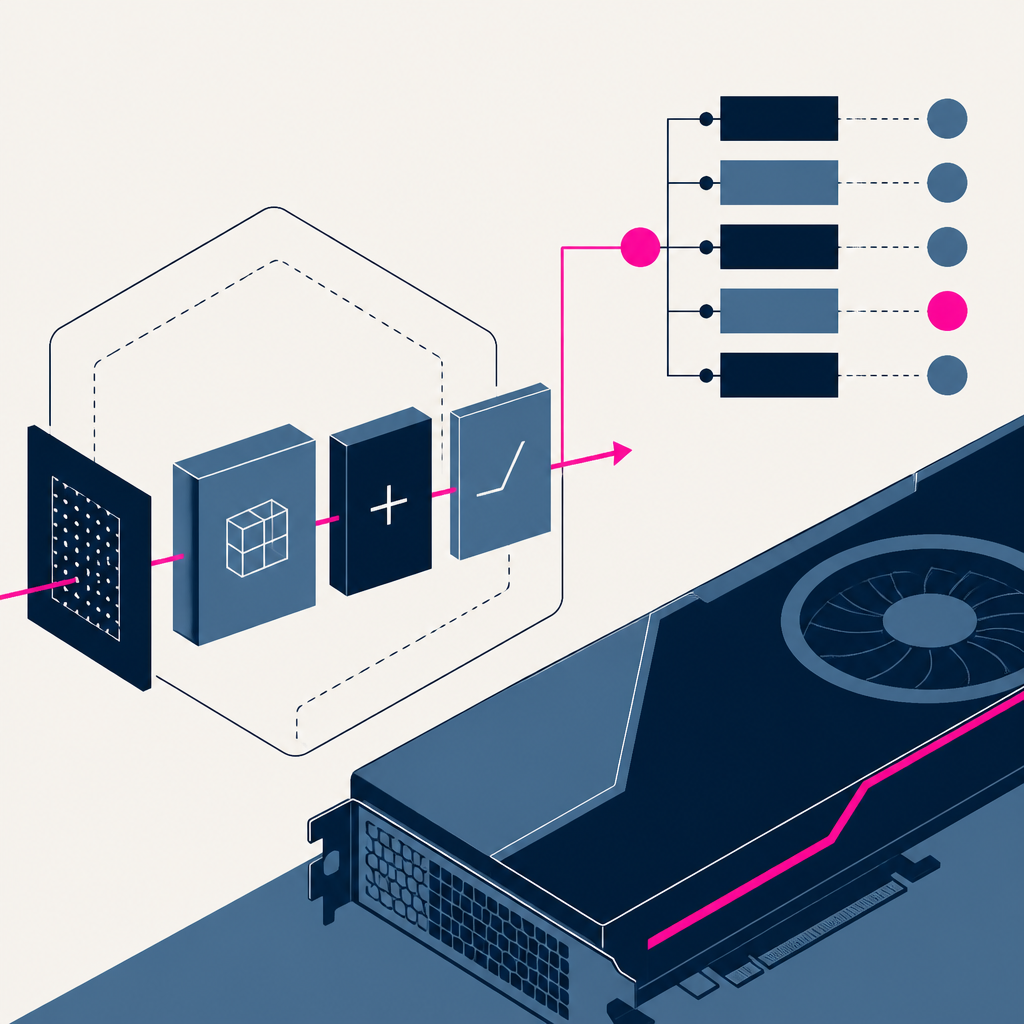 Inside NVIDIA’s cuDNN Graph API: Fusion, Autotuning, and Plan Reuse with cuDNN Frontend
MarkTechPost · 1 day ago ·
25
Inside NVIDIA’s cuDNN Graph API: Fusion, Autotuning, and Plan Reuse with cuDNN Frontend
MarkTechPost · 1 day ago ·
25
 Validating Distributed LLM Serving Benchmarks with NVIDIA srt-slurm, SLURM Recipes, Parameter Sweeps, and Pareto Analysis
MarkTechPost · 1 month ago ·
33
Validating Distributed LLM Serving Benchmarks with NVIDIA srt-slurm, SLURM Recipes, Parameter Sweeps, and Pareto Analysis
MarkTechPost · 1 month ago ·
33
 Fine-Tuning Qwen3 with LoRA Using NVIDIA NeMo AutoModel: A Complete Single-GPU Google Colab Workflow Tutorial
MarkTechPost · 1 month ago ·
8
Fine-Tuning Qwen3 with LoRA Using NVIDIA NeMo AutoModel: A Complete Single-GPU Google Colab Workflow Tutorial
MarkTechPost · 1 month ago ·
8