Alibaba
Company www.alibaba.com ● Covered in 126 stories + Follow ✴ AI Graph Claim this company LinkedIn
Alibaba is tracked in TLDRocket’s company dataset. Explore the recorded developments, relationships and supporting evidence below. Coverage reflects our monitored sources and may be incomplete.
Updated 23 October 2026
Signals
12 stories (+20%)
Media momentum
As of 1 Nov 2026 · Visible stories in the last 30 days, compared with the 30 days before.
32 sources
Source diversity
As of 1 Nov 2026 · Distinct publications behind this entity's visible coverage.
6 events
Release activity
As of 1 Nov 2026 · Model, product and open-source release events in the last 90 days whose coverage involves this entity.
1 event
Funding signals
As of 1 Nov 2026 · Funding and acquisition events in the last 90 days whose coverage involves this entity.
Apr 2018 → Oct 2026
Coverage span
As of 1 Nov 2026 · First to most recent month of TLDRocket coverage of this entity.
Market context
BABA · NYSE · last close $98.04 (30 Oct 2026)
-23.7% over this window · S&P 500 -2.3% (dashed line)
Price moves around recent events
-
Security issue: Cohere & Qwen3.8-Flash-Next Security issue
+0.7% next day, +0.4% vs S&P 500
-
Model release: Anthropic & Anthropic PBC Model release
0.0% next day, -0.6% vs S&P 500
-
Policy change: Alibaba & DeepSeek Policy change
+0.0% next day, -0.3% vs S&P 500 · -7.7% over 5 trading days, -7.5% vs S&P 500
-
Legal action: Anthropic & CoreWeave Legal action
0.0% next day, -0.3% vs S&P 500 · -6.1% over 5 trading days, -6.5% vs S&P 500
-
Model release: Decision 3.0 & Drex 1.5 Model release
-1.2% next day, -0.8% vs S&P 500 · +3.9% over 5 trading days, +4.9% vs S&P 500
Correlation does not establish causation. Market moves have many simultaneous causes — macro news, sector rotation, earnings and unrelated company events — and the timing of our daily closes may not align with when an event actually reached the market (pre-announcements, leaks, after-hours trading). Moves are shown next to the S&P 500 (SPY) over the same window so market-wide swings are visible, not hidden. None of this is investment advice.
Price history
BABA · daily closes$98.04 -43.6% · 12 months 52-week high $181.10 · low $91.99
12-month span · monthly close · 30 Oct 2025–30 Oct 2026
Daily · last 90 trading days
Candlestick · last 30 trading days
Read BABA is down 43.6% over twelve months, trading -45.9% from its 52-week high ($181.10, 22 Jan) — the strongest month was July at +27.4%.
Not investment advice. TLDRocket's market and earnings analysis is automated editorial commentary on public information. It can be wrong or out of date, it is never a recommendation to buy, sell or hold any security, and it should not be relied on for investment decisions.
Latest earnings
BABA · quarterly EPSQ1 2027 latest
8.47 EPS
est 10.62 -20.2%
Q1 2027
8.52 EPS
est 10.74 -20.7%
Q4 2026
0.62 EPS
est 5.91 -89.5%
Q3 2026
7.09 EPS
est 11.52 -38.5%
The TLDRocket take Q1 2027 · written 4 Sep 2026
Alibaba’s earnings print reads like a clean miss, not a close call. On the numbers given, it has missed estimates in four straight reported quarters: Q3 2026 at 7.09 versus 11.52, Q4 2026 at 0.62 versus 5.91, and two Q1 2027 entries at 8.52 versus 10.74 and 8.47 versus 10.62. The latest miss was 20.2%, which is bad, but still less ugly than the 89.5% hole in Q4 2026. So the direction is “still missing,” even if the degree of pain looks less catastrophic than that one quarter suggested.
What makes that interesting is that Alibaba is anything but quiet on AI product shipping. The company has been pushing the Qwen line hard, including Qwen3.8-Max, a 2.4 trillion parameter multimodal model with a 1 million token context window, API pricing at $2 per million input tokens, and plans to open-source the weights on Hugging Face, plus smaller open-source and on-device variants. Recent coverage also shows it leaning into low-cost Mixture-of-Experts models — only a slice of the model runs per token — with Qwen3.8-Flash and Qwen3.8-Flash-Next, while even launching adjacent consumer experiments like HappyShrimp for AI music. In plain English: the model factory is busy, but the EPS table does not show that effort translating neatly into earnings yet.
The competitive context is also crowded. Alibaba’s Qwen releases are showing up alongside Anthropic’s Claude family and Zhipu’s GLM-5.3-Flash, with our coverage noting that Zhipu and Alibaba independently converged on very similar multimodal Flash architectures. That suggests Alibaba is keeping pace technically, not operating in a vacuum. It also has a listed partnership tie to Apple, which is notable, but the data here does not say what revenue impact, if any, that partnership is having. Same for Qwen’s open-weight strategy: it clearly helps relevance and developer reach, but from the information provided, the financial payoff is still more thesis than proof.
Read alongside: Qwen3.8-Max Qwen Qwen 3.8 Max Apple Qwen2.5-Coder
Not investment advice. TLDRocket's market and earnings analysis is automated editorial commentary on public information. It can be wrong or out of date, it is never a recommendation to buy, sell or hold any security, and it should not be relied on for investment decisions.
Management records
updated 2 Oct 2026Observed in public listings; this is not a verified current management roster.
-
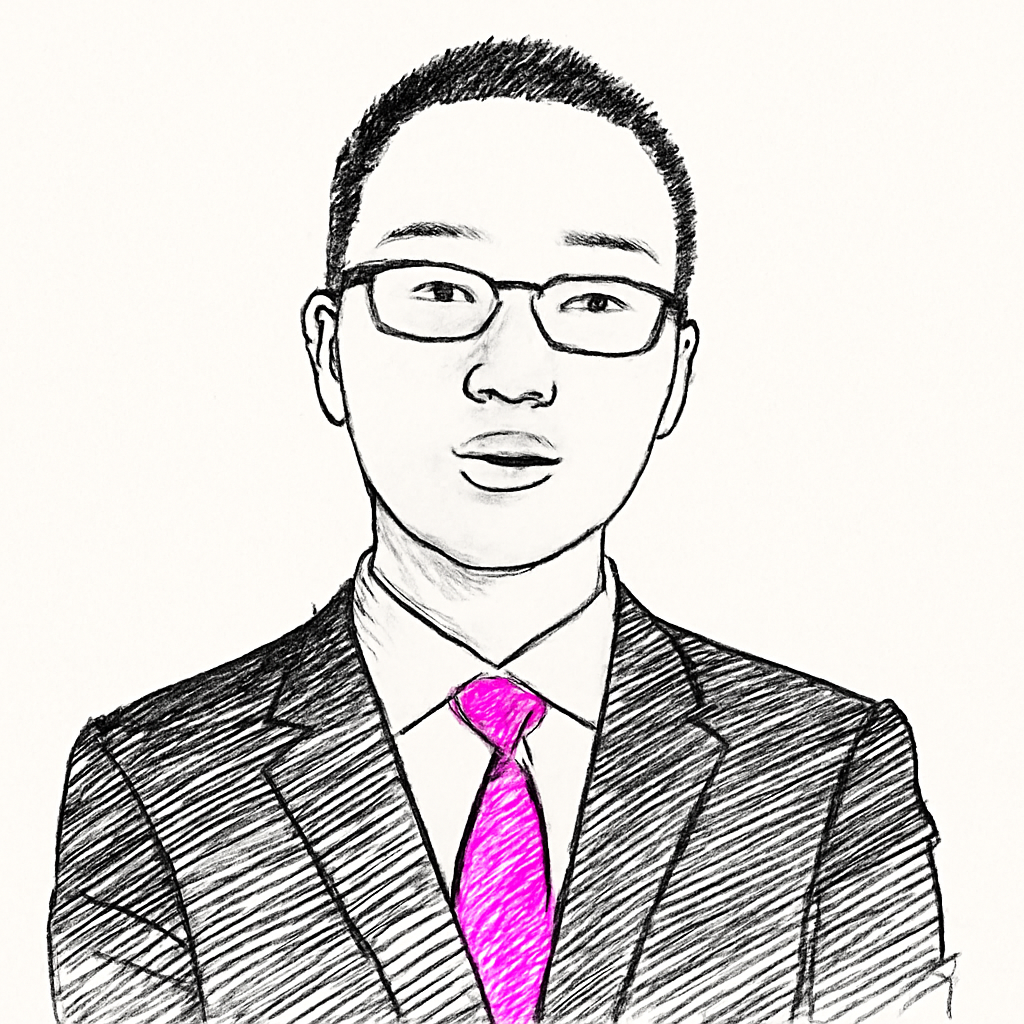 Eddie Wu
Director & CEO
-
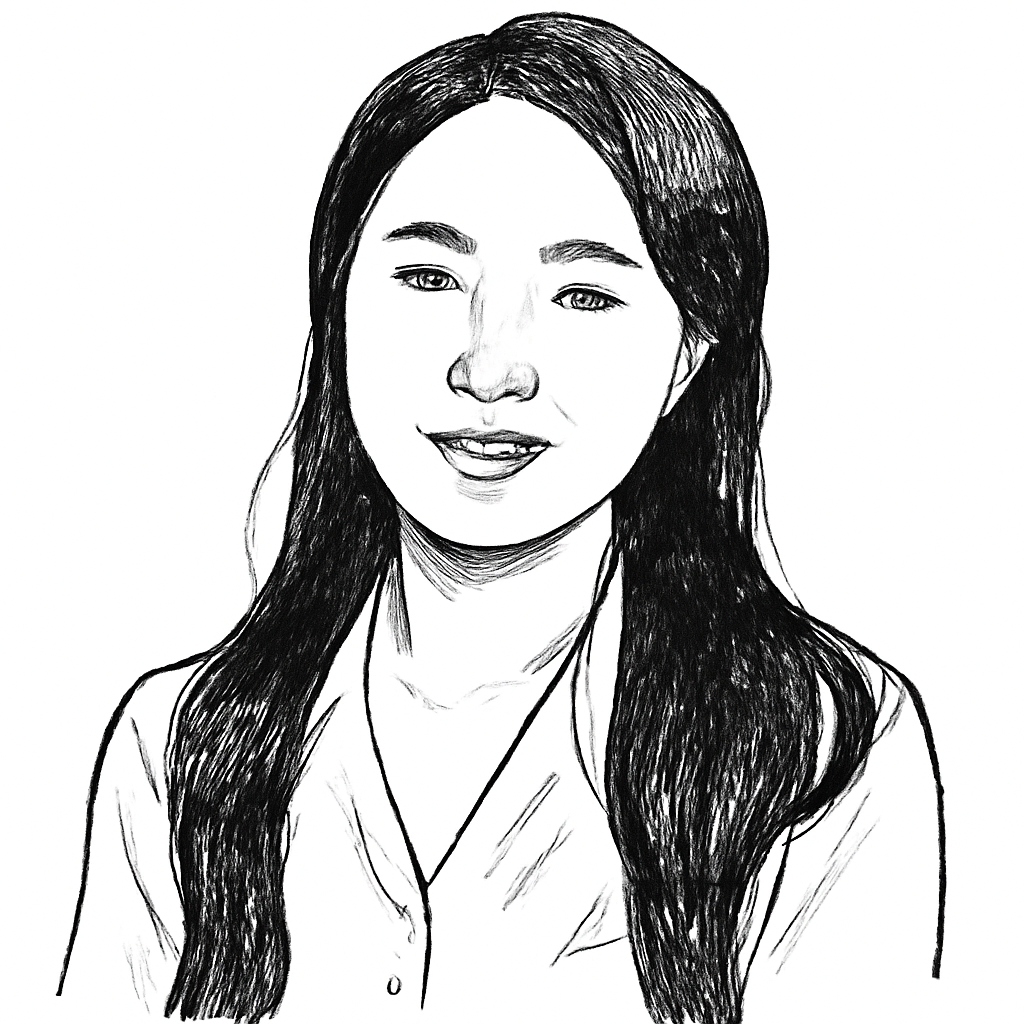 Bella Wong
Chief Operating Officer
-
 Fan Jiang
CEO of Alibaba E-commerce Business Group
- Chris Tung Chief Marketing Officer
-
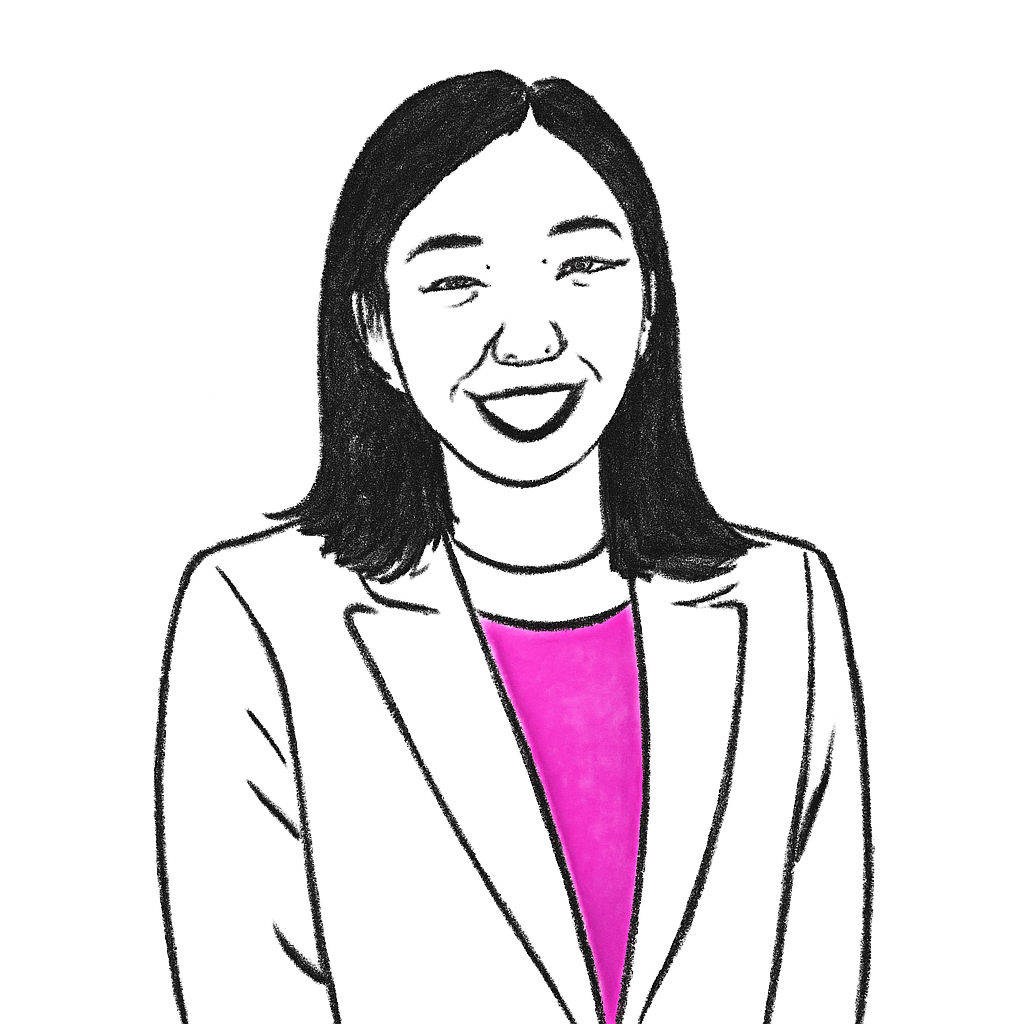 Jane Jiang
Chief People Officer
- Justine C. Vice President, International Corporate Affairs
- Colin Chen Special Assistant to CEO
- Andrew Lee Executive Director
- Sandy Liu EA to Chairman & CEO
- Walter Zheng President, Damai International
-
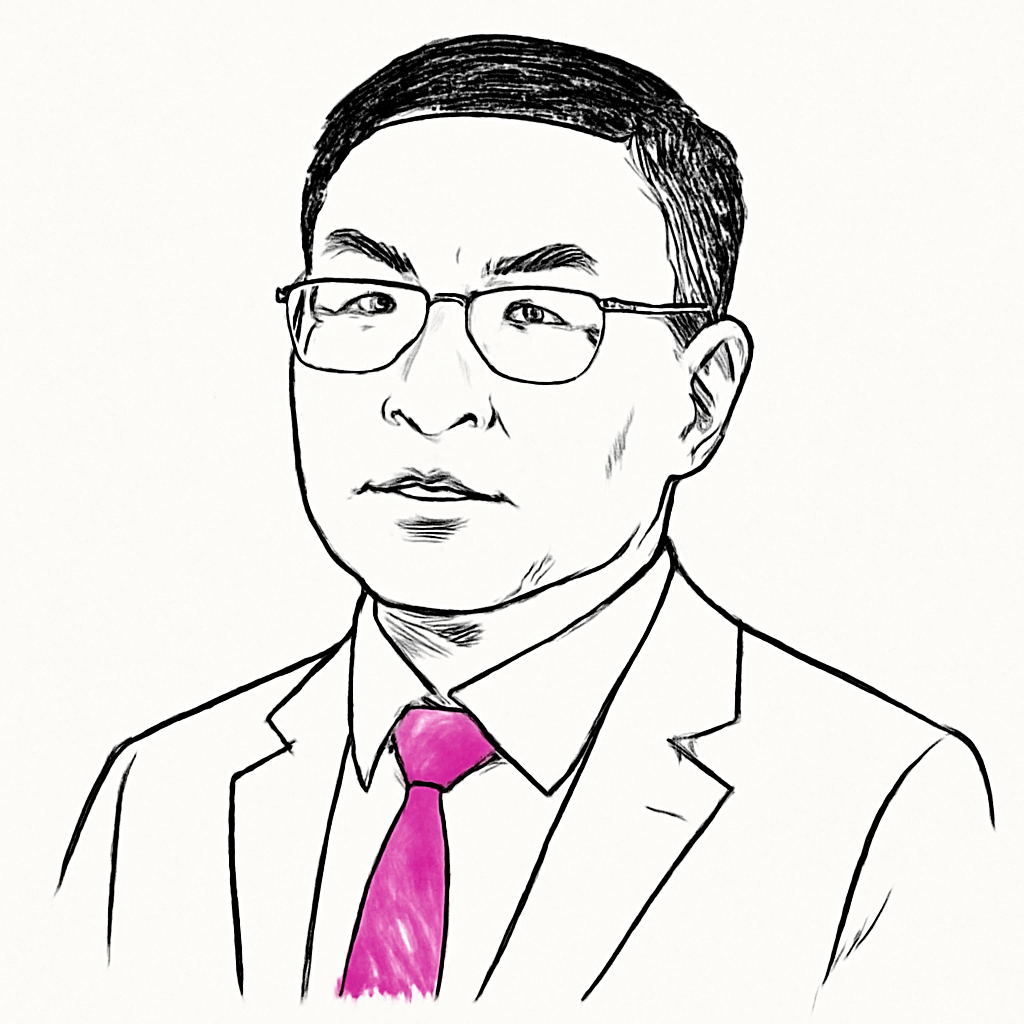 Scott Yang
Head of International Investment
-
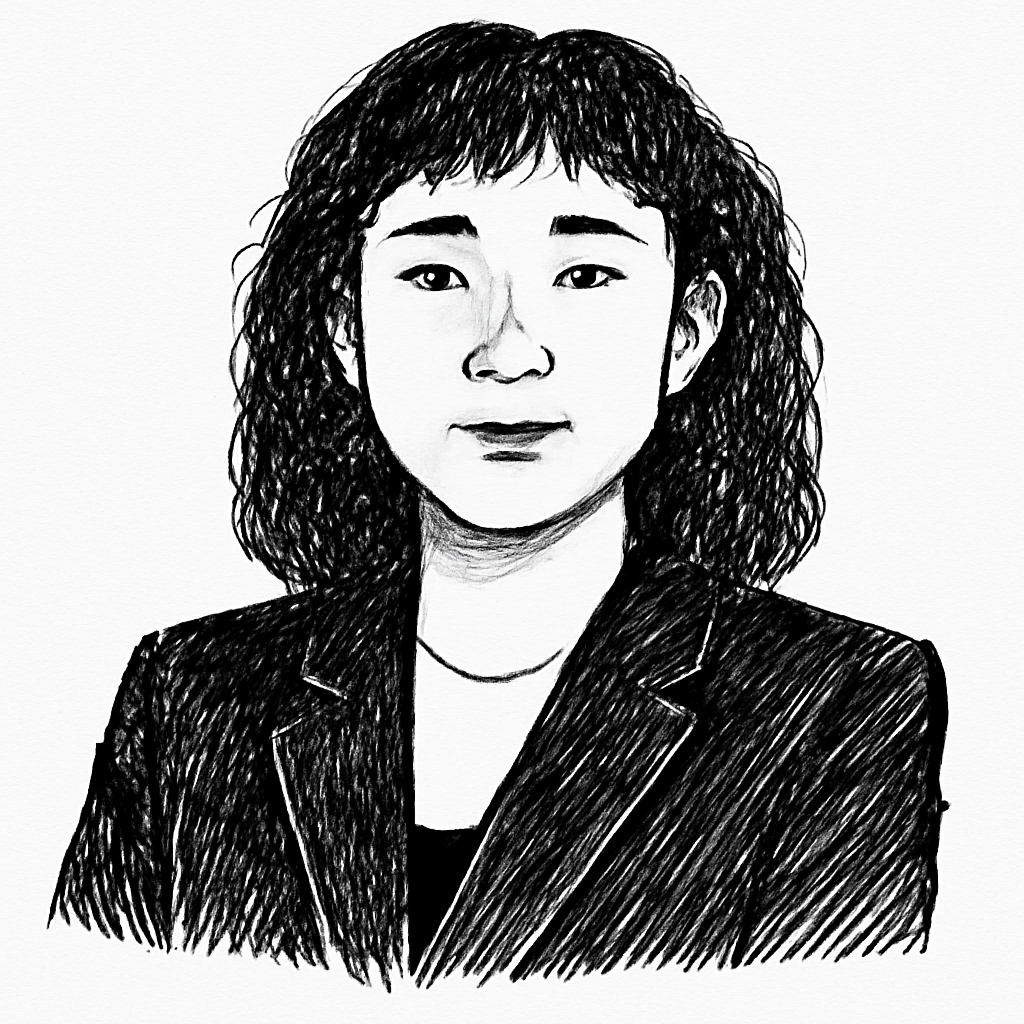 Rita Chen
总经理
+ 18 more tracked
View 12-month management history
Recent source observations
- Unverified observation Edward Wang Not found in a partial source snapshot (previously listed as 总经理); departure unconfirmed.
- Unverified observation Howard Hao Wang Not found in a partial source snapshot (previously listed as CTO, Lazada & Senior Director of Engineering); departure unconfirmed. LinkedIn
- Unverified observation Canghai Wan Not found in a partial source snapshot (previously listed as VP Alibaba Cloud International); departure unconfirmed.
- Unverified observation Fan Jiang Source title changed: CEO, E-commerce Business Group → CEO of Alibaba E-commerce Business Group; role change unconfirmed.
Latest developments
2026
Security issue: Cohere & Qwen3.8-Flash-Next Security issue
Model release: Anthropic & Anthropic PBC Model release
Policy change: Alibaba & DeepSeek Policy change
Legal action: Anthropic & CoreWeave Legal action
Model release: Decision 3.0 & Drex 1.5 Model release
Deployment: Alibaba & Amazon SageMaker AI Deployment
Model release: Alibaba & Alibaba Qwen Model release
Security issue: Alibaba & Anthropic Security issue
Benchmark result: Accio team & Claude Benchmark result
Open source release: Alibaba & GLM-5.3-Flash Open source release
Funding: Anthropic & Alibaba Funding
Model release: Qwen 3.8 27B & Qwen Research Model release
Model release: Alibaba & Qwen Model release
Deployment: Apple & Alibaba Deployment
Model release: Alibaba & Qwen 3.8 Max Model release
Policy change: ActID & DeepSeek Policy change
Open source release: AMD & Alibaba Open source release
Open source release: Alibaba & Artificial Analysis Open source release
- Model release: Anthropic & Alibaba
- Security issue: Cohere & Alibaba
- Security issue: Cohere & Alibaba
- Policy change: DeepSeek & Alibaba
- Legal action: Meta & Google
- Market development: Apple & Alibaba
- Market development: Alibaba & Tencent Cloud
- Market development: Alibaba & QwenGyre
- Model release: Microsoft & Microsoft-Decision-1
- Market development: Alibaba & Qwen-Image-2.1-Turbo
- Market development: Tencent & Alibaba
- Market development: Alibaba & Tongyi Qianwen
- Deployment: Alibaba & Qwen-Audio-3.1-Realtime
- Market development: NVIDIA & Ministry of Industry and Information Technology
- Market development: Qwen & Qwen-Image-2.1
- Market development: Alibaba & Anthropic
- Model release: Alibaba & Qwen
- Market development: Alibaba & Qwen
- Security issue: Anthropic & Claude
- Security issue: DeepSeek & Alibaba
- Market development: Alibaba & Qwen team
- Benchmark result: Alibaba & Accio team
- Market development: Anthropic & Claude Fable 5.1
- Market development: Alibaba
- Open source release: Z.ai & Alibaba
- Open source release: Alibaba & Qwen3.8-Flash
- Open source release: Alibaba & Qwen3.8-Flash-Next
- Funding: Anthropic & The New York Times
- Model release: Alibaba & Qwen3.8-27B
- Model release: Alibaba & Qwen Research
- Model release: Alibaba & Qwen
- Deployment: Apple & Alibaba
- Market development: Alibaba & Qwen3.8 2.4T
- Deployment: Apple & Alibaba
- Market development: ByteDance & Alibaba
- Market development: Alibaba & Qwen3.8-Max
- Model release: Alibaba & Qwen3.8-Max
- Model release: Alibaba & Qwen3.8-Max
- Model release: Alibaba & Qwen 3.8 Max
- Model release: Alibaba & Qwen3.8-Max
- Model release: Alibaba & Qwen3.8-Max
- Model release: Alibaba & Qwen3.8-Max
- Model release: Alibaba & Qwen3.8-Max
- Model release: Alibaba & OpenAI
- Model release: Alibaba & Qwen3.8-Max
- Model release: Alibaba & Qwen3.8-Max
- Market development: Alibaba & ByteDance
- Policy change: ByteDance & OpenRouter
- Open source release: Moonshot AI & Kimi K3
- Open source release: Alibaba & Qwen3.7-Max
Relationships
Products & technology
- Develops Qwen3.8-Max · 12 sources
- Develops Qwen · 7 sources
- Develops Qwen 3.8 Max · 3 sources
- Integrated with Claude · 2 sources
- Develops Qwen3 · 2 sources
- Develops Qwen 3.8 · 2 sources
- Develops Qwen-72B · 2 sources
- Develops Qwen2.5-Coder · 2 sources
- Develops Qwen2 · 2 sources
- Develops Qwen2.5 · 2 sources
Partnerships
- Apple partnered with this company · 3 sources
Investment & ownership
- Owns Qwen · 2 sources