Microsoft
Company www.microsoft.com ● Covered in 342 stories + Follow ✴ AI Graph Claim this company
Microsoft is tracked in TLDRocket’s company dataset. Explore the recorded developments, relationships and supporting evidence below. Coverage reflects our monitored sources and may be incomplete.
Updated 23 October 2026
Signals
104 stories (+35%)
Media momentum
As of 2 Nov 2026 · Visible stories in the last 30 days, compared with the 30 days before.
44 sources
Source diversity
As of 2 Nov 2026 · Distinct publications behind this entity's visible coverage.
16 events
Release activity
As of 2 Nov 2026 · Model, product and open-source release events in the last 90 days whose coverage involves this entity.
10 events
Funding signals
As of 2 Nov 2026 · Funding and acquisition events in the last 90 days whose coverage involves this entity.
Nov 2016 → Nov 2026
Coverage span
As of 2 Nov 2026 · First to most recent month of TLDRocket coverage of this entity.
Market context
MSFT · NASDAQ · last close $521.91 (30 Oct 2026)
+4.4% over this window · S&P 500 -2.3% (dashed line)
Price moves around recent events
-
Policy change: Anthropic & Anthropic PBC Policy change
— insufficient price data
-
Other: Microsoft & OpenAI Other
-0.2% next day, +0.2% vs S&P 500
-
Feature update: Alphabet & Amazon Feature update
-0.2% next day, +0.2% vs S&P 500
-
Model release: GitHub & Microsoft Model release
-0.2% next day, +0.2% vs S&P 500
-
Executive move: Microsoft & OpenAI Executive move
-0.1% next day, -0.4% vs S&P 500
Correlation does not establish causation. Market moves have many simultaneous causes — macro news, sector rotation, earnings and unrelated company events — and the timing of our daily closes may not align with when an event actually reached the market (pre-announcements, leaks, after-hours trading). Moves are shown next to the S&P 500 (SPY) over the same window so market-wide swings are visible, not hidden. None of this is investment advice.
Price history
MSFT · daily closes$521.91 -0.7% · 12 months 52-week high $551.15 · low $349.20
12-month span · monthly close · 30 Oct 2025–30 Oct 2026
Daily · last 90 trading days
Candlestick · last 30 trading days
Read MSFT is down 0.7% over twelve months, trading -5.3% from its 52-week high ($551.15, 13 Oct) — the strongest month was July at +24.6%.
Not investment advice. TLDRocket's market and earnings analysis is automated editorial commentary on public information. It can be wrong or out of date, it is never a recommendation to buy, sell or hold any security, and it should not be relied on for investment decisions.
Latest earnings
MSFT · quarterly EPSQ1 2027 latest
4.89 EPS
est 4.82 +1.5%
Q1 2027
4.89 EPS
est 4.82 +1.5%
Q4 2026
4.74 EPS
est 4.33 +9.5%
Q3 2026
4.27 EPS
est 4.14 +3.1%
The TLDRocket take Q1 2027 · written 28 Oct 2026
Microsoft posted another beat: Q1 2027 EPS came in at 4.89 versus 4.82 expected, its fourth straight quarter ahead of consensus. The streak is clean, and the underlying EPS line is still moving up quarter to quarter from 4.14 to 4.27 to 4.74 to 4.89, even if this quarter’s surprise was the smallest of the four at 1.5% after 9.5%, 3.1%, and 2.6%. That reads less like a stumble than a company running so hot that expectations have mostly caught up.
The operating story in the coverage is straightforward: Azure did $33.2 billion in the July–September quarter, about $850 million above analyst expectations, and Microsoft also recorded $10 billion of revenue from commercial arrangements with OpenAI. That fits the company’s heaviest coverage areas — AI infrastructure, enterprise AI, and agents — and it helps explain why Copilot and the OpenAI partnership keep showing up as the commercial center of gravity. In plain English: Microsoft is making money not just from selling AI tools, but from being the cloud and distribution layer underneath them.
What is less clear from the data here is how durable each AI product line is on its own. Microsoft is pushing into areas as varied as medical diagnosis with MAI-DxO and enterprise work software with Copilot, while also turning off Copilot support on some smart TVs — so not every surface is sacred. The security angle matters too: the EchoLeak demonstration around Microsoft 365 Copilot is a reminder that enterprise AI revenue and enterprise AI risk tend to ship in the same box.
Read alongside: Satya Nadella OpenAI Surface Laptop Ultra Copilot Copilot
Not investment advice. TLDRocket's market and earnings analysis is automated editorial commentary on public information. It can be wrong or out of date, it is never a recommendation to buy, sell or hold any security, and it should not be relied on for investment decisions.
Management records
updated 2 Nov 2026Observed in public listings; this is not a verified current management roster.
-
 Satya Nadella
LinkedIn
Chairman & CEO
-
 Amy Hood
EVP & CFO
-
 Kevin Scott
CTO Microsoft
-
 Judson Althoff
LinkedIn
CEO, Microsoft Commercial Business
-
 Carolina Dybeck Happe
EVP & COO
-
 Brad Smith
President & Vice Chair
-
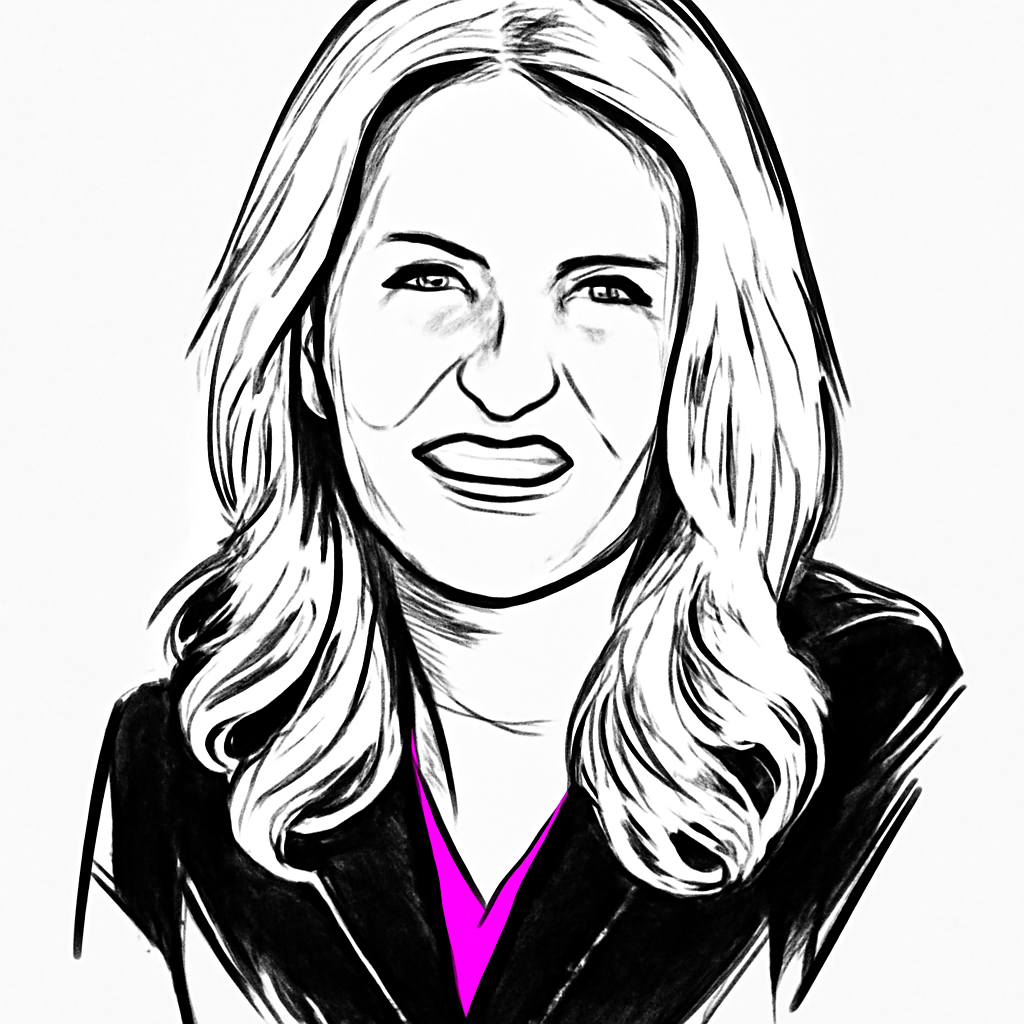 Amy Coleman
Executive Vice President, Chief People Officer
- Takeshi Numoto Executive Vice President and Chief Marketing Officer
- Sandra E. Peterson LinkedIn Board Member
-
 Reid Hoffman
LinkedIn
Board Member
-
 John David Rainey
Board Member
- Emma Walmsley LinkedIn Board Member
+ 8 more tracked
View 12-month management history
Recent source observations
- Unverified observation Kevin Scott Source title changed: CTO & EVP of AI → CTO Microsoft; role change unconfirmed.
- Unverified observation 楊文龍 Not found in a partial source snapshot (previously listed as 副CEO); departure unconfirmed.
- Unverified observation Zixuan Zhang Not found in a partial source snapshot (previously listed as Chief of Staff); departure unconfirmed.
- Unverified observation Steve Sungjae Kim Not found in a partial source snapshot (previously listed as Chief of Staff); departure unconfirmed.
- Unverified observation Sowmya Ramjee Not found in a partial source snapshot (previously listed as Chief of Staff); departure unconfirmed.
- Unverified observation Sophie Byrne Not found in a partial source snapshot (previously listed as Chief of Staff); departure unconfirmed.
Latest developments
November 2026
October 2026
Policy change: Anthropic & Anthropic PBC Policy change
Other: Microsoft & OpenAI Other
Feature update: Alphabet & Amazon Feature update
Model release: GitHub & Microsoft Model release
Executive move: Microsoft & OpenAI Executive move
Funding: Anthropic & Anthropic PBC Funding
Model release: Canva & Canva Craft Model release
Incident: ConnectWise & Microsoft Incident
Research publication: Microsoft & GPT-5 Research publication
Security issue: Amazon & National Cyber Security Centre Security issue
Research publication: Anthropic & Claude Opus 3 Research publication
Funding: Pigment & $5bn investment fund Funding
Incident: AINews & Cloudflare Incident
Partnership: Cloudflare & Microsoft Partnership
Other: Cloudflare & VoidZero Other
Other: Anthropic & Amazon Web Services Other
Legal action: Anthropic & CoreWeave Legal action
Model release: LFM2.5-24B-A2B & Liquid AI Model release
Deployment: Microsoft & NVIDIA Deployment
Partnership: Microsoft & NVIDIA Partnership
Partnership: Microsoft & NVIDIA Partnership
- Feature update: Amazon & Alphabet
- Policy change: Google LLC & Microsoft
- Feature update: Alphabet & Amazon
- Policy change: OpenAI & Google
- Market development: Microsoft & Microsoft Research
- Feature update: Alphabet & Microsoft
- Model release: Microsoft & Microsoft Foundry
- Market development: Microsoft & Microsoft Research
- Executive move: Microsoft
- Feature update: Alphabet & Amazon
- Executive move: Microsoft
- Other: Microsoft
- Executive move: Microsoft & OpenAI
- Other: Microsoft & Amazon Web Services
- Other: Microsoft & OpenAI
- Other: Microsoft & OpenAI
- Market development: Microsoft & LG
- Market development: Meta & Ndoc
- Funding: Anthropic & Alibaba
- Market development: Microsoft & Toyota Industries
- Executive move: Microsoft
- Executive move: Microsoft & SiliconANGLE
- Incident: Microsoft & Amazon
- Executive move: Microsoft
- Funding: Anthropic & Amazon
- Market development: Microsoft & Microsoft Entra Conditional Access
- Incident: Microsoft
- Security issue: Microsoft & BBC
- Market development: Microsoft & Microsoft Foundry
- Research publication: Microsoft & GPT-5
- Research publication: Microsoft
- Research publication: Microsoft
- Model release: Canva & Canva Craft
- Incident: ConnectWise & Microsoft
- Market development: Google & Amazon
- Research publication: Microsoft
- Market development: Microsoft & Gates Foundation
- Incident: Microsoft
- Funding: Pigment & NVIDIA
- Research publication: Anthropic & Claude Opus 3
- Market development: NVIDIA & Microsoft
- Other: Cloudflare & Microsoft
- Other: Anthropic & Amazon Web Services
- Market development: Microsoft & OpenAI
- Market development: Nscale & Microsoft
- Legal action: Meta & Google
- Model release: Microsoft & MAI-Base-2
- Deployment: Microsoft & Apple
- Deployment: Microsoft & Surface Laptop Ultra
Relationships
People
- Satya Nadella employed by this company · 11 sources
- Employed by Satya Nadella · 5 sources
Partnerships
Products & technology
- Deploys Surface Laptop Ultra · 9 sources
- Deploys Copilot · 8 sources
- Develops Copilot · 6 sources
- Develops Copilot · 4 sources
Investment & ownership
Competition
Also known as: microsoft corp.