Company www.google.com ● Covered in 861 stories + Follow ✴ AI Graph Claim this company LinkedIn
Google is tracked in TLDRocket’s company dataset. Explore the recorded developments, relationships and supporting evidence below. Coverage reflects our monitored sources and may be incomplete.
Updated 23 October 2026
Signals
172 stories (+22%)
Media momentum
As of 2 Nov 2026 · Visible stories in the last 30 days, compared with the 30 days before.
62 sources
Source diversity
As of 2 Nov 2026 · Distinct publications behind this entity's visible coverage.
51 events
Release activity
As of 2 Nov 2026 · Model, product and open-source release events in the last 90 days whose coverage involves this entity.
10 events
Funding signals
As of 2 Nov 2026 · Funding and acquisition events in the last 90 days whose coverage involves this entity.
Jun 2016 → Nov 2026
Coverage span
As of 2 Nov 2026 · First to most recent month of TLDRocket coverage of this entity.
Funding history
-
Undisclosed Acquisition announced
Market context
GOOGL · NASDAQ · last close $279.84 (30 Oct 2026)
-21.0% over this window · S&P 500 -2.3% (dashed line)
Price moves around recent events
-
Deployment: Gemma 4 & Google Deployment
— insufficient price data
-
Policy change: Anthropic & Anthropic PBC Policy change
— insufficient price data
-
Feature update: Reddit & Google Feature update
-1.4% next day, +0.4% vs S&P 500
-
Feature update: Alphabet & Amazon Feature update
-12.6% next day, -12.3% vs S&P 500
-
Feature update: Autofill & Google Feature update
-12.6% next day, -12.3% vs S&P 500
Correlation does not establish causation. Market moves have many simultaneous causes — macro news, sector rotation, earnings and unrelated company events — and the timing of our daily closes may not align with when an event actually reached the market (pre-announcements, leaks, after-hours trading). Moves are shown next to the S&P 500 (SPY) over the same window so market-wide swings are visible, not hidden. None of this is investment advice.
Price history
GOOGL · daily closes$279.84 -0.6% · 12 months 52-week high $408.61 · low $270.70
12-month span · monthly close · 30 Oct 2025–30 Oct 2026
Daily · last 90 trading days
Previous 24 hours · 5-minute close +0.17%
Candlestick · last 30 trading days
Read GOOGL is down 0.6% over twelve months, trading -31.5% from its 52-week high ($408.61, 18 May) — the strongest month was April at +33.8%.
Not investment advice. TLDRocket's market and earnings analysis is automated editorial commentary on public information. It can be wrong or out of date, it is never a recommendation to buy, sell or hold any security, and it should not be relied on for investment decisions.
Latest earnings
GOOGL · quarterly EPSQ3 2026 latest
2.12 EPS
est 3.11 -31.8%
Q2 2026
2.85 EPS
est 2.98 -4.4%
Q1 2026
2.62 EPS
est 2.71 -3.1%
Q4 2025
2.82 EPS
est 2.71 +4.2%
The TLDRocket take Q3 2026 · written 28 Oct 2026
The numbers have turned the wrong way: Google missed EPS by 31.8% in Q3 2026, after smaller misses in Q2 and Q1, following a modest beat in Q4 2025. That makes three straight misses, capped by a much larger one this quarter. On the information here, the clean read is that a company still shipping aggressively in AI is not translating that activity into near-term earnings performance the way estimates expected.
That shipping pace is real enough. Google has been pushing Gemini deeper into the stack, from Gemini 4 Carbon at the model layer to Agent Compute Engine and TorchTPU on the infrastructure and developer side, while also widening AI Search ad monetization internationally as core Search ad growth slows. Those moves fit the topics most associated with the company — AI agents, security, and infrastructure — and they matter because Google is building both the models and the pipes. But there is a difference between broadening the platform and proving the economics, and this EPS run says investors were expecting better proof by now.
The related-company picture reinforces that point: Gemini and Gemini 4 Argon dominate the coverage graph, so a lot of the AI story around Google still rides on its own model family rather than on some external winner lifting all boats. Carbon edging past Anthropic’s Claude Opus 5.5 in one benchmark is useful competitive color, but benchmarks do not pay the quarter’s bills. What we do not have here is segment detail, updated guidance, or a direct breakdown of how much Cloud, Search ads, or AI infrastructure spending drove the miss, so the cause of the earnings shortfall remains more inference than fact.
Read alongside: Gemini Gemini 4 Argon Gemini 3.5 Flash Gemini 3.6 Flash Gemini 3.7 Flash
Not investment advice. TLDRocket's market and earnings analysis is automated editorial commentary on public information. It can be wrong or out of date, it is never a recommendation to buy, sell or hold any security, and it should not be relied on for investment decisions.
Management records
updated 2 Nov 2026Observed in public listings; this is not a verified current management roster.
-
 Sundar Pichai
LinkedIn
CEO
- Ruth Porat LinkedIn President & Chief Investment Officer
-
 Anat Ashkenazi
Chief Financial Officer
-
 Thomas Kurian
LinkedIn
CEO - Google Cloud
- Don Harrison President, Global Partnerships & Corporate Development
-
 Lorraine Twohill
LinkedIn
Chief Marketing Officer
-
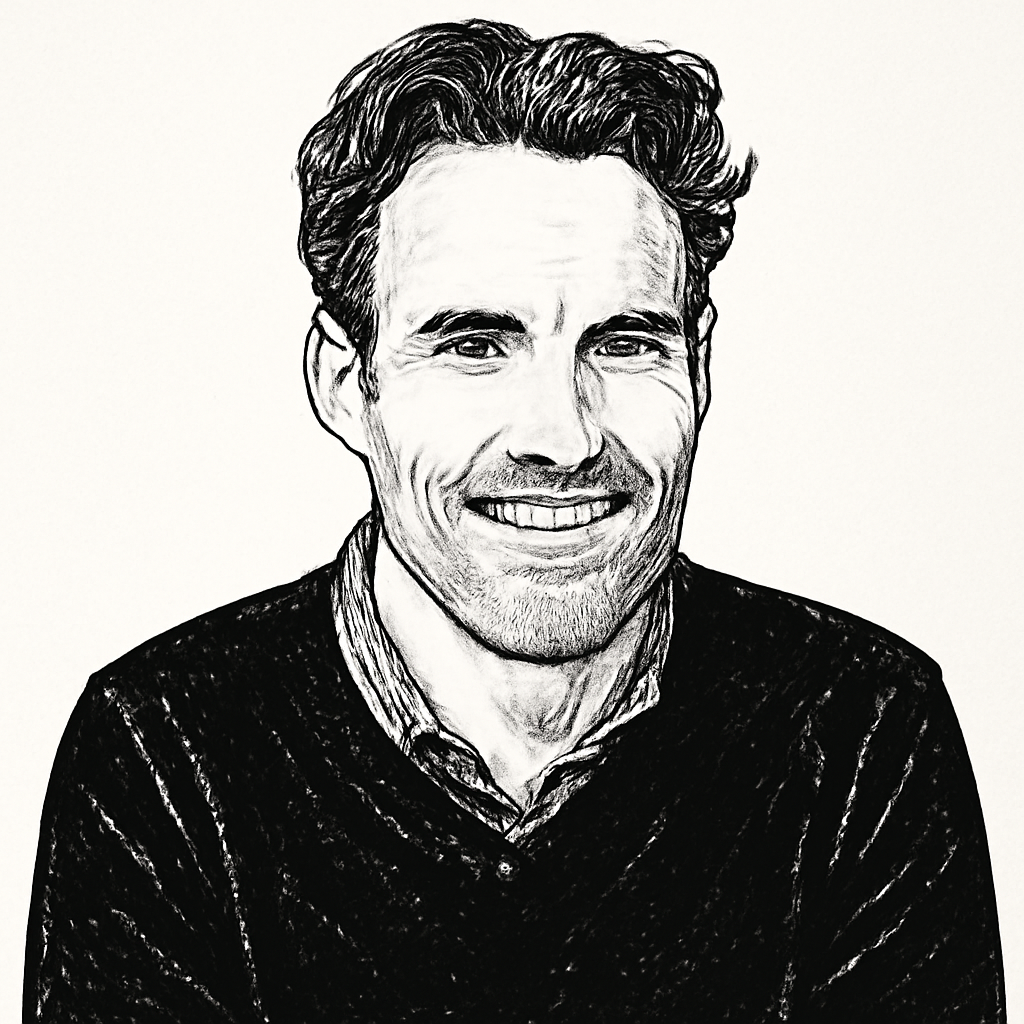 Phillipp Schindler
LinkedIn
SVP, Chief Business Officer
-
 Neal Mohan
CEO of YouTube
- Rick Osterloh LinkedIn Senior Vice President, Platforms & Devices
- Valerie Grillo Vice President, Human Resources
-
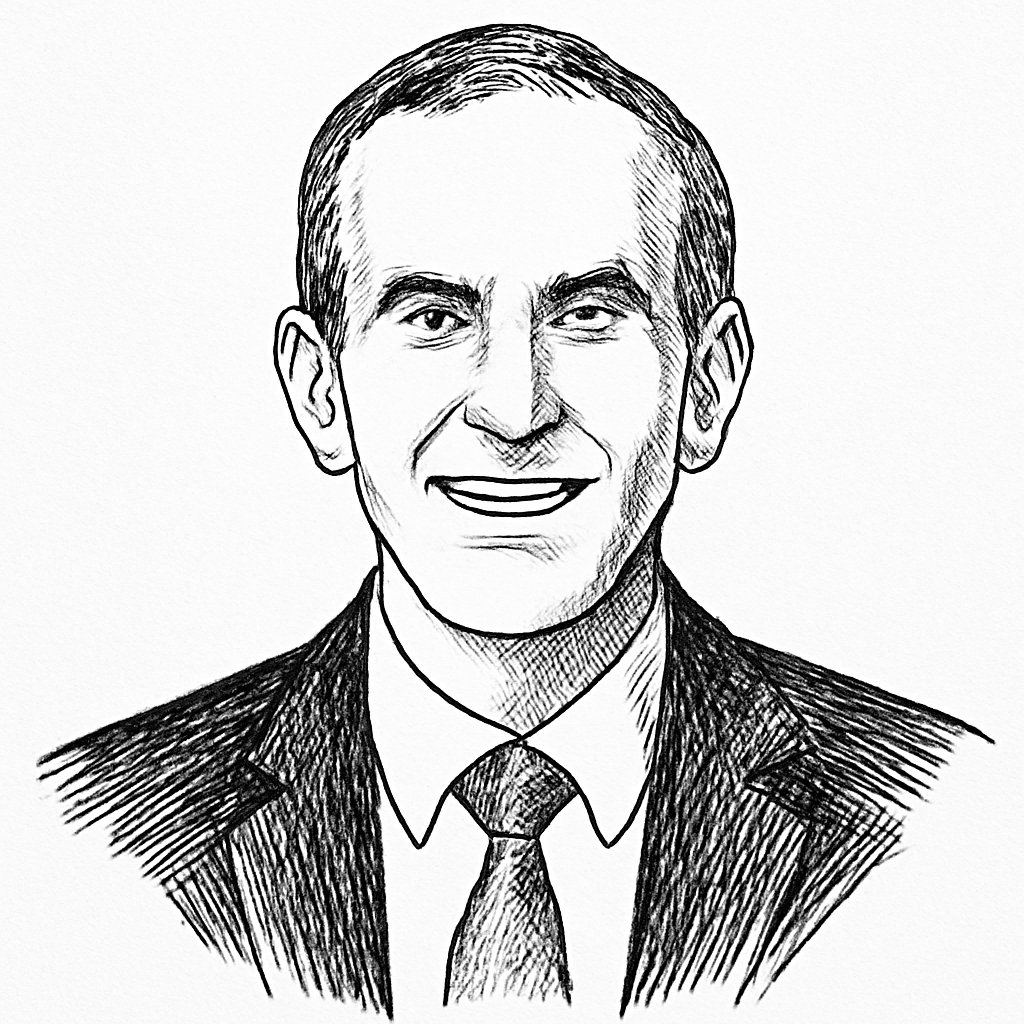 Kent Walker
President, Global Affairs
-
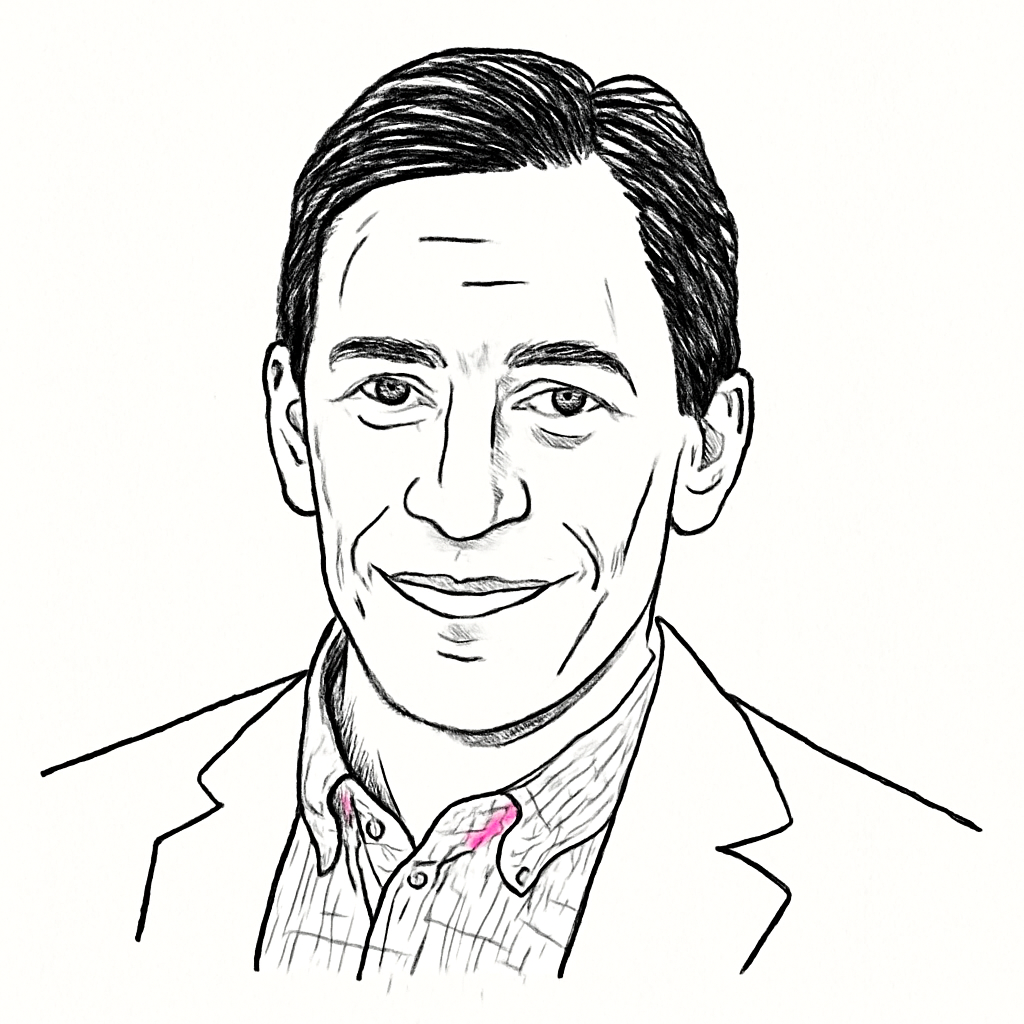 Dinni Jain
CEO, Google Fiber Webpass
+ 10 more tracked
View 12-month management history
Recent source observations
- Unverified observation Neal Mohan Observed in a source listing as CEO of YouTube; start date unknown.
- Unverified observation Shilpa Santosh Not found in a partial source snapshot (previously listed as Head of People Strategy & Operations); departure unconfirmed.
- Unverified observation Selin Song Not found in a partial source snapshot (previously listed as President, Google Customer Solutions); departure unconfirmed.
- Unverified observation Sameer Samat Not found in a partial source snapshot (previously listed as President, Android Ecosystem); departure unconfirmed. LinkedIn
- Unverified observation Sagel T. Not found in a partial source snapshot (previously listed as People Operations Engagement Program Manager, Office Of The Chief People Officer); departure unconfirmed.
- Unverified observation Kate Brandt Not found in a partial source snapshot (previously listed as Chief Sustainability Officer); departure unconfirmed. LinkedIn
Latest developments
November 2026
- Market development: GPT-6 Astra & Genie 4
- Market development: Google
- Market development: Google & Gemini
October 2026
Deployment: Gemma 4 & Google Deployment
Policy change: Anthropic & Anthropic PBC Policy change
Feature update: Reddit & Google Feature update
Feature update: Alphabet & Amazon Feature update
Feature update: Autofill & Google Feature update
Model release: Anthropic & DeepSeek Model release
Partnership: Google & Oracle Partnership
Funding: Atlas Bio & Atlas Bio foundational AI model for in silico clinical trials Funding
Model release: DeepMind & Genie 4 Model release
Partnership: OpenAI & Oracle Partnership
Model release: Claude Opus 5.5 & Gemini 4 Argon Model release
Funding: Anthropic & Anthropic PBC Funding
Partnership: Amazon & Google Partnership
Partnership: Blackstone & Crux AI Partnership
Partnership: Google & Red Hat Partnership
Partnership: Google & IBM Partnership
Partnership: Financial Times & Google Partnership
Partnership: CNN & Google Partnership
Partnership: Axios & Google Partnership
Partnership: BIDMC & Google Partnership
Partnership: Google & Gemini Enterprise Partnership
Partnership: Constellation & Google Partnership
- Market development: VideoLAN & Netflix
- Feature update: Google
- Market development: Google & DeepMind
- Feature update: Google & Intel
- Market development: Anthropic & OpenAI
- Deployment: Google & SpaceX
- Policy change: OpenAI & Google
- Deployment: Google & Gemma 4
- Market development: Google & Amazon
- Market development: Google & Tuike Finland
- Feature update: Google & Alphabet
- Feature update: Alphabet & Google
- Feature update: Reddit & Google
- Feature update: Alphabet & Google
- Feature update: Alphabet & Google
- Market development: Google Gemini & Google
- Feature update: Samsung & Google
- Feature update: Alphabet & Google
- Model release: Google & Gemini 4 Carbon
- Feature update: Google & Chrome
- Model release: Google & Gemini 4 Carbon
- Feature update: Alphabet & Google
- Feature update: Google & Alphabet
- Model release: Google & Gemini 4 Carbon
- Market development: Xreal & Google
- Model release: Google & Artificial Analysis
- Market development: Google
- Market development: Google & Android Studio Rabbit 2
- Model release: Google & Gemini 4 Carbon
- Market development: Google & Gemini
- Feature update: Google & Google Chrome
- Feature update: Alphabet & Google
- Model release: Google & Gemini 4 Carbon
- Model release: DeepSeek & Google
- Partnership: Oracle & Google
- Model release: Google DeepMind & Genie 4
- Funding: Anthropic & Amazon
- Partnership: Oracle & Google
- Model release: Google & Genie 4
- Model release: DeepMind & Genie 4
- Market development: CLEAR & OpenAI
- Market development: Meta & Ndoc
- Funding: Atlas Bio & Google
- Model release: Google & Genie 4
- Market development: Google
- Market development: Gemini Notebook & Google
- Market development: Google & The Stepback
Relationships
Products & technology
- Develops Gemini · 59 sources
- Develops Gemini 4 Argon · 15 sources
- Deploys Gemini · 12 sources
- Deploys Gemini 4 Argon · 11 sources
- Develops Gemini 3.5 Flash · 10 sources
- Develops Gemini 3.6 Flash · 9 sources
- Develops Gemini 3.5 Flash Cyber · 8 sources
- Develops Gemini 3.7 Flash · 8 sources
- Integrated with Gemini API · 8 sources
- Develops Gemini 3.5 Flash-Lite · 6 sources
- Develops Gemini 3 Pro · 6 sources
- Develops Gemma 4 · 6 sources