TSMC
Company ● Covered in 12 stories + Follow ✴ AI Graph Claim this company
TSMC is tracked in TLDRocket’s company dataset. Explore the recorded developments, relationships and supporting evidence below. Coverage reflects our monitored sources and may be incomplete.
Updated 29 October 2026
Signals
2 stories (-33%)
Media momentum
As of 1 Nov 2026 · Visible stories in the last 30 days, compared with the 30 days before.
10 sources
Source diversity
As of 1 Nov 2026 · Distinct publications behind this entity's visible coverage.
—
Release activity
As of 1 Nov 2026 · Model, product and open-source release events in the last 90 days whose coverage involves this entity.
—
Funding signals
As of 1 Nov 2026 · Funding and acquisition events in the last 90 days whose coverage involves this entity.
Sep 2025 → Oct 2026
Coverage span
As of 1 Nov 2026 · First to most recent month of TLDRocket coverage of this entity.
Market context
TSM · NYSE · last close $406.13 (30 Oct 2026)
-3.3% over this window · S&P 500 -2.3% (dashed line)
Price moves around recent events
-
Partnership: TSMC Partnership
+1.8% next day, +1.4% vs S&P 500 · +1.4% over 5 trading days, +1.9% vs S&P 500
-
Funding: TSMC Funding
-0.8% next day, -0.4% vs S&P 500 · -5.8% over 5 trading days, -4.6% vs S&P 500
-
Funding: Etched & Sequoia Capital Funding
— insufficient price data
-
Partnership: NVIDIA & Blackwell Partnership
— insufficient price data
-
Model release: Etched & GPT-5.6 Model release
— insufficient price data
Correlation does not establish causation. Market moves have many simultaneous causes — macro news, sector rotation, earnings and unrelated company events — and the timing of our daily closes may not align with when an event actually reached the market (pre-announcements, leaks, after-hours trading). Moves are shown next to the S&P 500 (SPY) over the same window so market-wide swings are visible, not hidden. None of this is investment advice.
Price history
TSM · daily closes$406.13 +33.9% · 12 months 52-week high $487.47 · low $266.82
12-month span · monthly close · 30 Oct 2025–30 Oct 2026
Daily · last 90 trading days
Candlestick · last 30 trading days
Read TSM is up 33.9% over twelve months, trading -16.7% from its 52-week high ($487.47, 5 Oct) — the strongest month was April at +17.2%.
Not investment advice. TLDRocket's market and earnings analysis is automated editorial commentary on public information. It can be wrong or out of date, it is never a recommendation to buy, sell or hold any security, and it should not be relied on for investment decisions.
Latest earnings
TSM · quarterly EPSQ3 2026 latest
148.94 EPS
est 29.24 +409.4%
Q2 2026
27.25 EPS
est 24.57 +10.9%
Q1 2026
22.08 EPS
est 21.14 +4.4%
Q4 2025
19.51 EPS
est 18.54 +5.2%
The TLDRocket take Q3 2026 · written 15 Oct 2026
TSMC’s numbers say one simple thing first: it keeps beating. That is four straight quarterly EPS beats, with the usual modest pattern in Q4 2025 through Q2 2026 suddenly turning into a Q3 2026 blowout: 148.94 actual versus 29.24 expected, a 409.4% surprise. That Q3 figure is so far above the prior three quarters that it dominates the readout, and with the data here we can say it was enormous, not why it was that enormous. The broader pattern is still clear enough: estimates have been too low for a company sitting at the center of AI chip manufacturing demand.
That lines up with the coverage. TSMC is the foundry underneath a lot of the AI infrastructure stack, including work tied to NVIDIA and newer accelerator efforts like Etched, which has already taped out and moved into production on TSMC’s manufacturing. It also fits the geopolitics story: Taiwan is leaning on semiconductor clout while the US pushes for more domestic capacity, and TSMC’s cited $265 billion Arizona investment shows how “chip diplomacy” is becoming concrete capex, not just conference talk. The interesting tension is that TSMC remains the dominant node in this supply chain even as Taiwan’s market and policymakers keep talking about broadening the ecosystem beyond one giant listing. For now, the earnings table says the giant is still doing giant things.
Read alongside: Amazon Web Services Blackwell Etched Ascend NVIDIA
Not investment advice. TLDRocket's market and earnings analysis is automated editorial commentary on public information. It can be wrong or out of date, it is never a recommendation to buy, sell or hold any security, and it should not be relied on for investment decisions.
Management records
updated 2 Oct 2026Observed in public listings; this is not a verified current management roster.
- C. C. Wei Vice Chairman & CEO
- Y.P. Chyn EVP & Co-COO
-
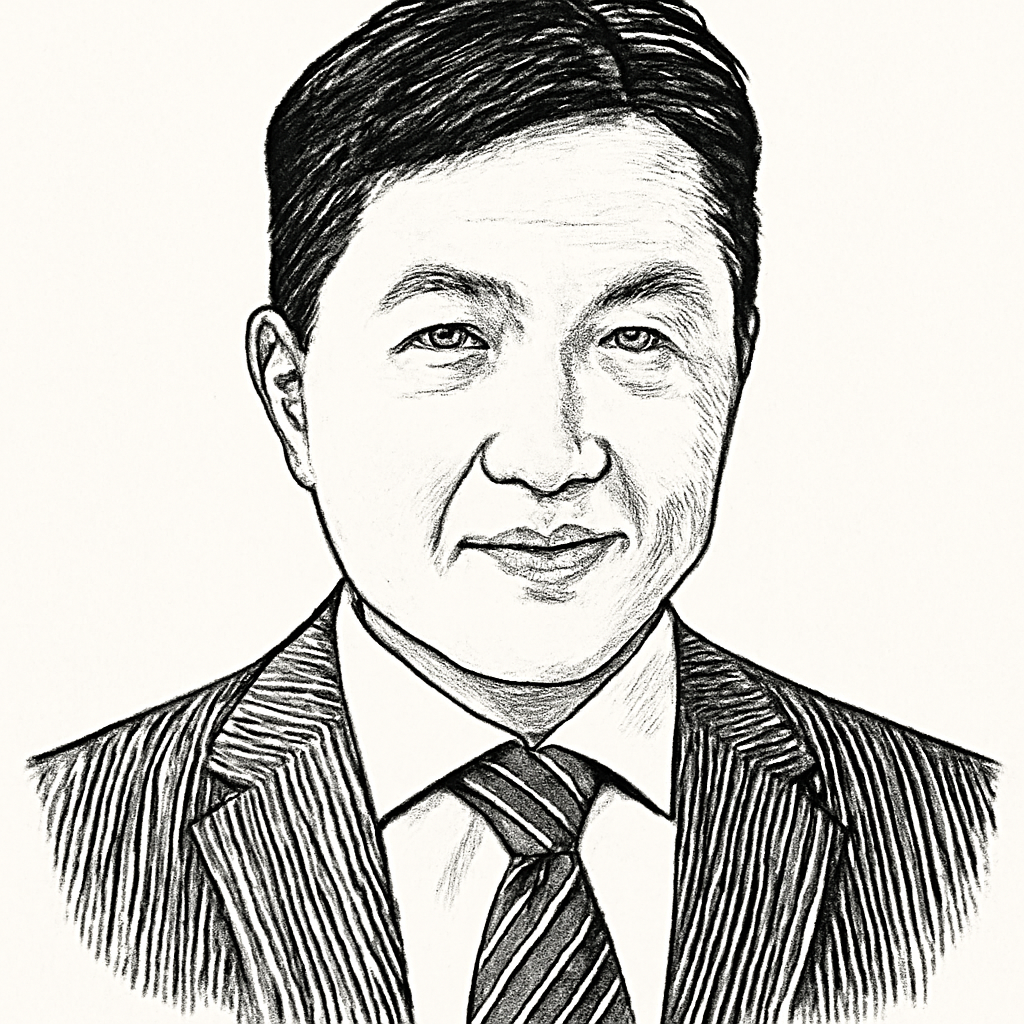 Chris Horng - Dar Lin
VP, Corporate Information Technology & Chief Information Officer
- Sylvia Fang VP Legal and General Counsel
-
 Christopher Thomas
President of TSMC Europe
-
 H.-S. Philip Wong
Chief Scientist, TSMC
-
 Wendell Huang
Senior Director - Finance
-
 Roger Luo
President of TSMC China & President of TSMC Nanjing
-
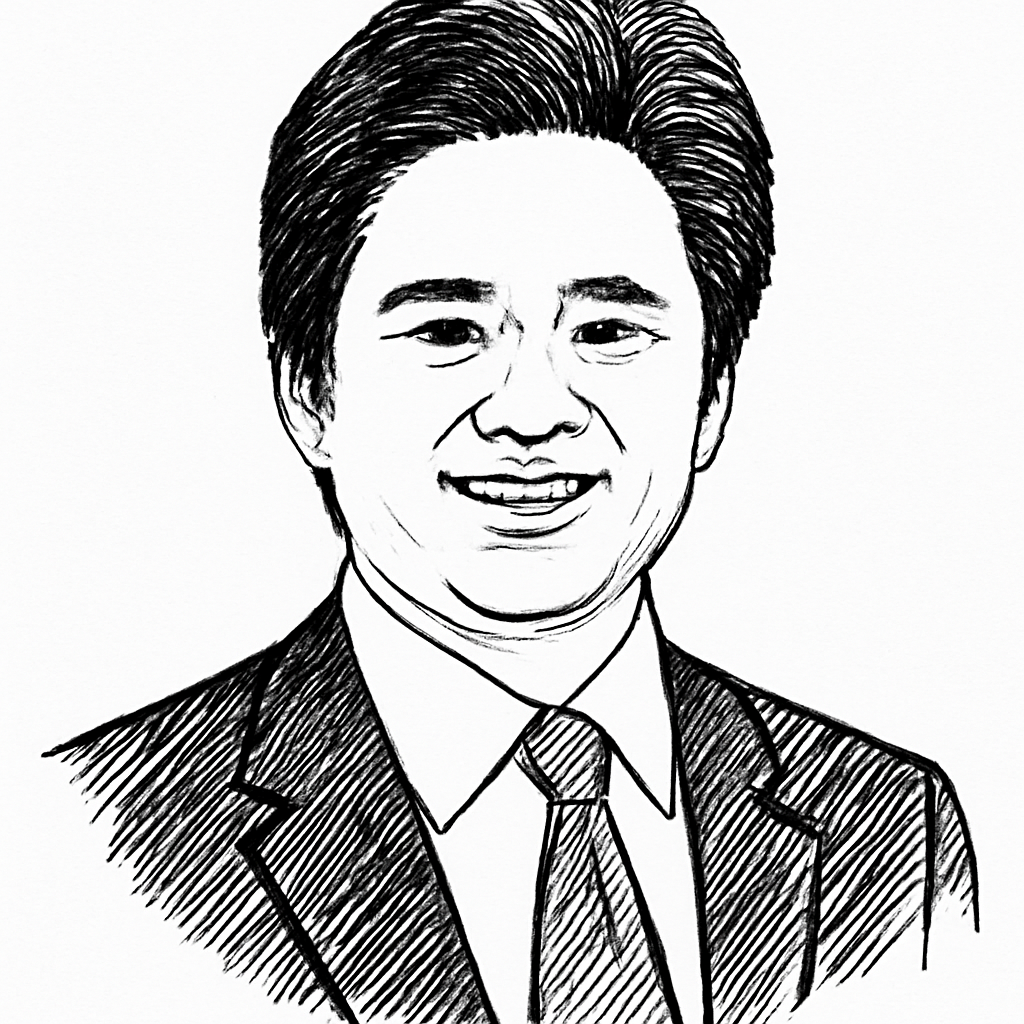 Makoto Onodera
President of TSMC Japan
-
 T.S. Chang
TSMC Fellow and VP, Operations / Advanced Technology and Mask Engineering
- Connie Ma VP HR
View 12-month management history
Recent source observations
- Unverified observation Wendell Huang Source title changed: Vice President, Finance and Chief Financial Officer / Spokesperson → Senior Director - Finance; role change unconfirmed.
Latest developments
October 2026
Partnership: TSMC Partnership
September 2026
Funding: TSMC Funding
- Market development: TSMC & NVIDIA
- Market development: Taiwan Stock Exchange & TSMC
- Market development: TSMC
August 2026
July 2026
Funding: Etched & Sequoia Capital Funding
Partnership: NVIDIA & Blackwell Partnership
June 2026
Model release: Etched & GPT-5.6 Model release
September 2025
Relationships
Products & technology
- Supplies Blackwell · 1 source
- Supplies Ascend · 1 source
- Supplies NVIDIA · 1 source
- Supplies Apple · 1 source
- Supplies Broadcom · 1 source
- Supplies Google · 1 source
- Supplies Amazon · 1 source
Investment & ownership
- Invests in United States · 1 source
Partnerships
- Partnered with Elon Musk · 1 source
- Amazon Web Services partnered with this company · 1 source
- Etched partnered with this company · 1 source