
Intel
Company www.intel.com ● Covered in 22 stories + Follow ✴ AI Graph
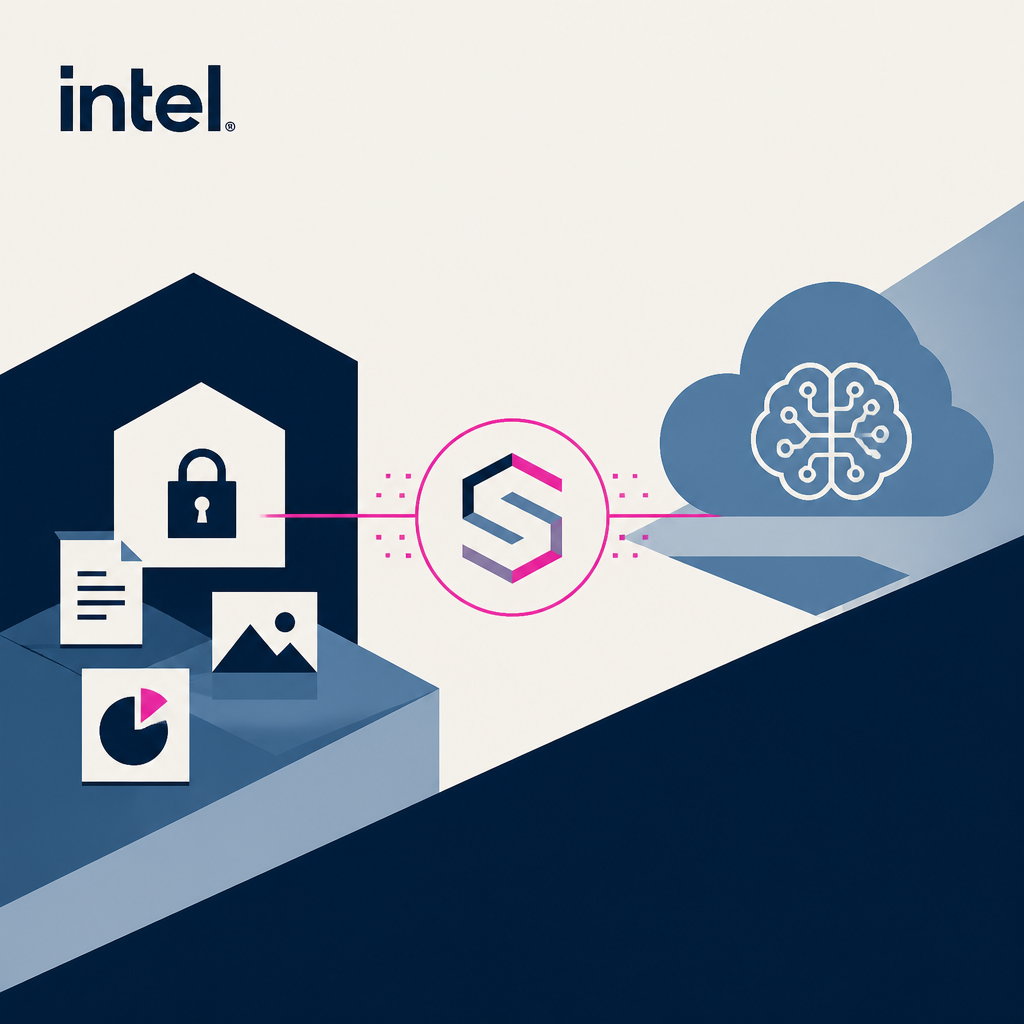
Intel is working on AI systems and tooling that span both deployment efficiency and hybrid execution. Recent coverage includes its development of AutoRound, a post-training quantization method for LLMs and VLMs, and its SuperClaw hybrid AI architecture that splits workloads between local models for sensitive data and cloud models for more complex reasoning. Intel has also extended its benchmarking ecosystem for agentic AI, including Terminal-Bench updates intended to evaluate agent performance beyond language-model inference.
Updated 14 September 2026
Signals
2 stories (-60%)
Media momentum
As of 17 Sep 2026 · Visible stories in the last 30 days, compared with the 30 days before.
9 sources
Source diversity
As of 17 Sep 2026 · Distinct publications behind this entity's visible coverage.
1 event
Release activity
As of 17 Sep 2026 · Model, product and open-source release events in the last 90 days whose coverage involves this entity.
1 event
Funding signals
As of 17 Sep 2026 · Funding and acquisition events in the last 90 days whose coverage involves this entity.
Nov 2021 → Sep 2026
Coverage span
As of 17 Sep 2026 · First to most recent month of TLDRocket coverage of this entity.
Market context
INTC · NASDAQ · last close $101.05 (16 Sep 2026)
+12.0% over this window · S&P 500 +0.9% (dashed line)
Price moves around recent events
-
Nvidia agreed to acquire Hugging Face for about $12.9 billion Acquisition
-2.9% next day, -2.6% vs S&P 500 · -0.5% over 5 trading days, -0.7% vs S&P 500
-
Multiple organizations publish research and tools for enterprise agentic AI deployment and optimization Research publication
— insufficient price data
-
— insufficient price data
-
— insufficient price data
Correlation does not establish causation. Market moves have many simultaneous causes — macro news, sector rotation, earnings and unrelated company events — and the timing of our daily closes may not align with when an event actually reached the market (pre-announcements, leaks, after-hours trading). Moves are shown next to the S&P 500 (SPY) over the same window so market-wide swings are visible, not hidden. None of this is investment advice.
Price history
INTC · daily closes$101.05 +299.9% · 12 months 52-week high $142.35 · low $24.45
12-month span · monthly close · 16 Sep 2025–16 Sep 2026
Daily · last 90 trading days
Previous 24 hours · 5-minute close +9.47%
Candlestick · last 30 trading days
Read INTC is up 299.9% over twelve months, trading -29.0% from its 52-week high ($142.35, 30 Jun) — the strongest month was April at +114.1%.
Not investment advice. TLDRocket's market and earnings analysis is automated editorial commentary on public information. It can be wrong or out of date, it is never a recommendation to buy, sell or hold any security, and it should not be relied on for investment decisions.
Latest earnings
INTC · quarterly EPSQ2 2026 latest
0.42 EPS
est 0.22 +92.9%
Q1 2026
0.29 EPS
est 0.01 +1971.4%
Q4 2025
0.15 EPS
est 0.08 +80.9%
Q3 2025
0.23 EPS
est 0.01 +2200.0%
The TLDRocket take Q2 2026 · written 5 Aug 2026
Four quarters in a row Intel has blown past estimates - Q2 2026 came in at 0.42 versus a 0.22 forecast, and the quarter before that beat by nearly 2000%. Worth pausing on that last number: when the estimate is a penny, a 3-cent beat looks like a moonshot on paper even though the dollar amounts are still modest by Intel's historical standards. The pattern here isn't explosive growth so much as analysts consistently lowballing a company that's still finding its footing - which is its own kind of signal about how little confidence Wall Street has priced in.
On the product side, Intel's story right now is about carving out a place in inference, the cheaper, faster stage of AI where a trained model actually answers queries, as opposed to training, the expensive process of building the model in the first place. Gaudi accelerators are showing up in Dell's Enterprise Hub and IBM's Db2 Genius Hub, and the company has been shipping quantization work - compressing large models so they run cheaper - through Optimum Intel and its Hugging Face partnership. That's a sensible lane to compete in since Nvidia's newly detailed Vera CPU is explicitly aimed at the data-center training market where Intel has struggled to keep pace, and startups like Groq and Cerebras are also circling inference specifically. Mobileye's Stellantis deal for hands-free driving, meanwhile, is a separate and slower-moving bet that has nothing to do with the AI chip fight but does show Intel diversifying its revenue base.
What's still unclear from what we have here: no revenue or margin figures, no guidance, and no sense of how much of Gaudi's traction is paid deployment versus pilot programs with partners like Dell and IBM. The EPS beats are real and repeated, but repeated beats against very low bars aren't the same as evidence the core AI chip business is turning a corner against Nvidia.
Read alongside: PyTorch Mobileye BERT Hugging Face Optimum Intel
Not investment advice. TLDRocket's market and earnings analysis is automated editorial commentary on public information. It can be wrong or out of date, it is never a recommendation to buy, sell or hold any security, and it should not be relied on for investment decisions.
Management
updated 2 Sep 2026-
 Lip-Bu Tan
CEO
Lip-Bu Tan
CEO
-
 Naga Chandrasekaran
EVP– Chief Technology and Operations Officer – General Manager, Intel Foundry Technology and Manufacturing
Naga Chandrasekaran
EVP– Chief Technology and Operations Officer – General Manager, Intel Foundry Technology and Manufacturing
-
 Alex Katouzian
EVP & GM, Client Computing & Physical AI
Alex Katouzian
EVP & GM, Client Computing & Physical AI
- Benjamin R. Ostapuk Vice President, Director of Intellectual Property Legal Group
-
 David Zinsner
CFO
David Zinsner
CFO
-
 Safroadu Yeboah-Amankwah
SVP & Chief Strategy Officer
Safroadu Yeboah-Amankwah
SVP & Chief Strategy Officer
-
 Victoria Holroyd-Fogg
Interim Chief People Officer
Victoria Holroyd-Fogg
Interim Chief People Officer
- Carina Sandoval Executive Assistant to EVP, Chief Legal and People Officer
- Alexios Zavras Chief Open Source Compliance Officer
- Carolann Cervetti Bullock Vice President and Senior Director, Employment and Labor Legal
- Evangelina Almirantearena Vice President, Associate General Counsel
- James A. Murray VP; former Associate General Counsel & Director Competition Policy
+ 21 more tracked
Recent changes
- April Miller Boise left (was EVP & Chief Legal Officer)
- James A. Murray joined as VP; former Associate General Counsel & Director Competition Policy
- Evangelina Almirantearena joined as Vice President, Associate General Counsel
- Carolann Cervetti Bullock joined as Vice President and Senior Director, Employment and Labor Legal
- Alexios Zavras joined as Chief Open Source Compliance Officer
- Carina Sandoval joined as Executive Assistant to EVP, Chief Legal and People Officer
Latest developments
 Nvidia has $21 billion SpaceX stake, $30 billion in Intel shares
Fortune ·
22
Nvidia has $21 billion SpaceX stake, $30 billion in Intel shares
Fortune ·
22
 Watch: AI agents are leaving the cloud
YouTube · 1 month ago ·
48
Building the enterprise environment for agentic AI
MIT Technology Review · 1 month ago ·
30
Nvidia details its next-generation Vera CPU for AI, setting up challenge to AMD and Intel
CNBC · 1 month ago ·
25
Stellantis taps Mobileye for hands-free driving assist
The Verge · 1 month ago ·
46
IBM asks DBAs to trust AI to act on their behalf
The Register · 4 months ago ·
49
Watch: AI agents are leaving the cloud
YouTube · 1 month ago ·
48
Building the enterprise environment for agentic AI
MIT Technology Review · 1 month ago ·
30
Nvidia details its next-generation Vera CPU for AI, setting up challenge to AMD and Intel
CNBC · 1 month ago ·
25
Stellantis taps Mobileye for hands-free driving assist
The Verge · 1 month ago ·
46
IBM asks DBAs to trust AI to act on their behalf
The Register · 4 months ago ·
49
Q3 2026
Nvidia agreed to acquire Hugging Face for about $12.9 billion Acquisition
Multiple organizations publish research and tools for enterprise agentic AI deployment and optimization Research publication
- SK Hynix reportedly in talks with Intel to build memory chips in US
- Nvidia doesn’t need to block rival chips on Hugging Face. It just needs the defaults.
- Nvidia has $21 billion SpaceX stake, $30 billion in Intel shares
- Watch: AI agents are leaving the cloud
- Building the enterprise environment for agentic AI
- Nvidia details its next-generation Vera CPU for AI, setting up challenge to AMD and Intel
- Stellantis taps Mobileye for hands-free driving assist
Q2 2026
- IBM asks DBAs to trust AI to act on their behalf
- Inference is giving AI chip startups a second chance to make their mark
Q2 2025
- Dell Enterprise Hub is all you need to build AI on premises
- Introducing AutoRound: Intel’s Advanced Quantization for LLMs and VLMs
Q1 2025
Q2 2024
- Building Cost-Efficient Enterprise RAG applications with Intel Gaudi 2 and Intel Xeon
- Blazing Fast SetFit Inference with 🤗 Optimum Intel on Xeon
Q1 2024
- A Chatbot on your Laptop: Phi-2 on Intel Meteor Lake
- CPU Optimized Embeddings with 🤗 Optimum Intel and fastRAG
- Text-Generation Pipeline on Intel® Gaudi® 2 AI Accelerator
- Accelerate StarCoder with 🤗 Optimum Intel on Xeon: Q8/Q4 and Speculative Decoding
Q2 2022
Q1 2022
Q4 2021
Relationships
Products & technology
- Integrated with Terminal-Bench · 1 source
- Integrated with PyTorch · 1 source
- Integrated with BERT · 1 source
- Develops Optimum Intel · 1 source
- Integrated with StarCoder · 1 source
- Develops Gaudi 2 · 1 source
- Integrated with Llama 2 · 1 source
- Develops Intel Gaudi 2 · 1 source
- Develops Intel Xeon · 1 source
- Develops AutoRound · 1 source
Investment & ownership
- Owns Mobileye · 1 source
Partnerships
- Partnered with Hugging Face · 1 source