Unveiling Vizro: McKinsey's Open-Source Toolkit for Effortless Data Visualization
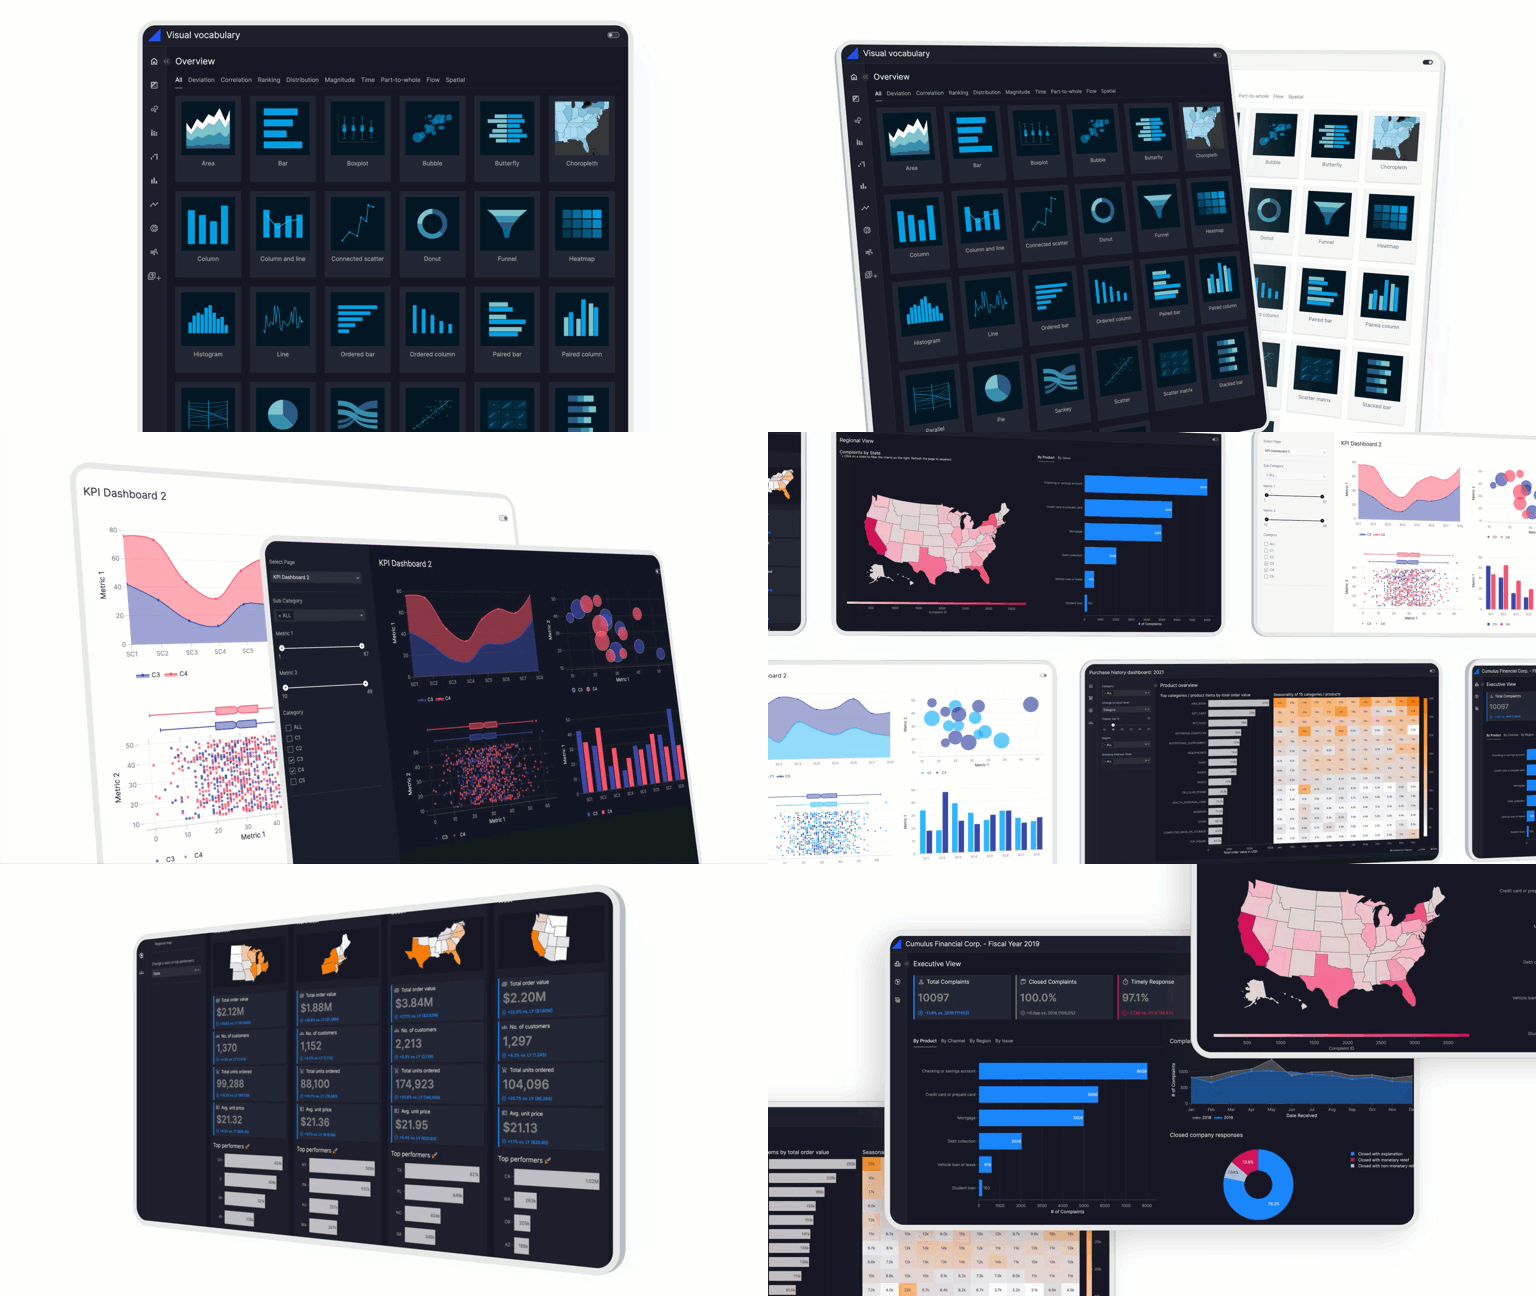
McKinsey has launched Vizro, an innovative open-source Python toolkit designed to simplify the creation of stunning, production-ready data visualization applications. This powerful tool enables users to build multi-page dashboards with minimal configuration, drastically reducing the complexity and length of code typically required for such projects.
With Vizro, developers can utilize configurations in formats such as JSON, YAML, or Python dictionaries to rapidly generate dashboards that could otherwise require thousands of lines of code. By leveraging well-known libraries like Plotly, Dash, and Pydantic, Vizro combines open-source flexibility with established best practices in design and scalability.
Key Features of Vizro
- Ease of Use: The toolkit is designed for quick learning and accessibility, making it ideal for both beginners and advanced users.
- Customization: Advanced users can tailor the toolkit to their specific needs, allowing for extensive customization in dashboard design.
- Seamless Transition: Vizro is capable of moving applications from prototype to production with ease, ensuring a smooth workflow.
In a forthcoming tutorial, users will learn to create a dashboard directly using the Vizro MCP server from the Claude Desktop environment. This integration showcases the toolkit's versatility and its potential to streamline the data visualization process.
As noted in the article by Arham Islam in MarkTechPost, the Vizro toolkit is not only a technical asset but also a significant step towards democratizing data visualization, making it accessible to a broader audience within the tech community.
Rocket Commentary
The launch of Vizro by McKinsey marks a significant advance in making data visualization more accessible to developers, potentially democratizing a field often reserved for those with extensive coding knowledge. By reducing the complexity associated with creating multi-page dashboards, Vizro not only accelerates the development process but also encourages a wider adoption of data-driven decision-making in businesses. However, while the toolkit's reliance on established libraries like Plotly and Dash signals a commitment to best practices, it is crucial to ensure that the open-source model fosters an inclusive and ethical environment for users. As more organizations lean on such tools, the industry must prioritize transparency and support to ensure that data visualization remains a transformative force rather than a mere technical convenience.
Read the Original Article
This summary was created from the original article. Click below to read the full story from the source.
Read Original Article